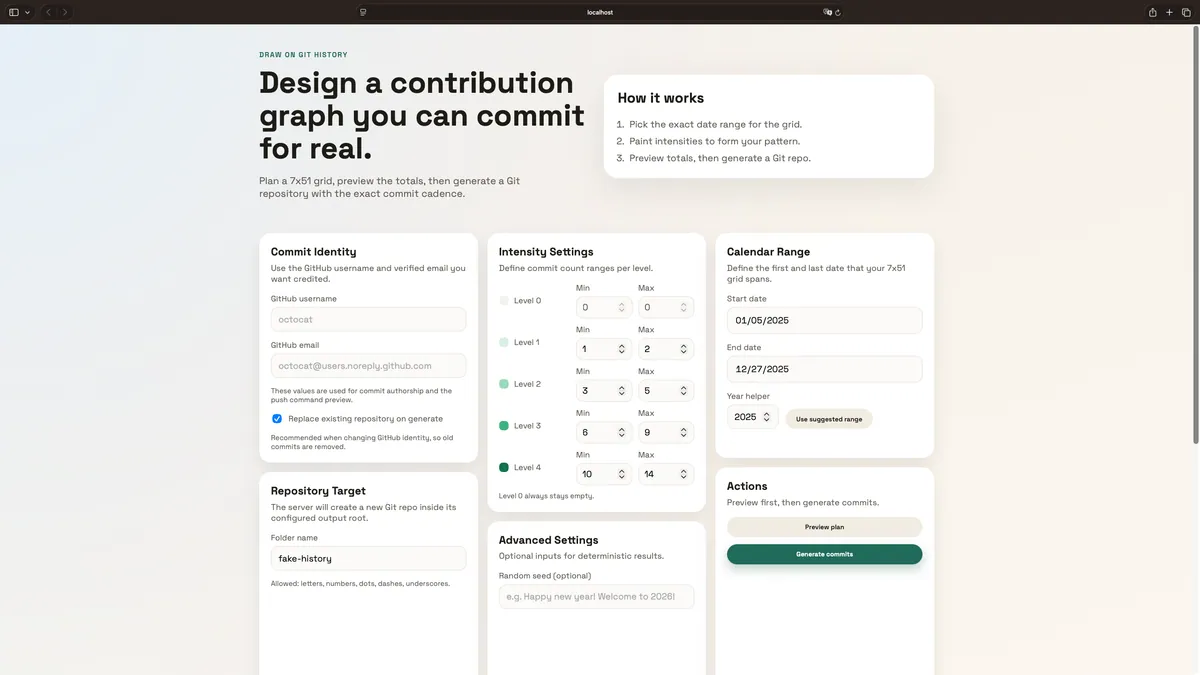
Draw on Git History treats the familiar GitHub contribution graph as a drawing surface. Users choose a calendar range, paint a pattern across five intensity levels, configure the commit-count range behind each level, and preview the total before generating anything.
The React client sends the 7x51 grid to an Express and TypeScript API, which validates the request and maps every cell to a calendar date. A seeded planner makes commit counts and timestamps reproducible, while the generator initializes a local repository, writes the dated commits, and includes a history.json audit record.
The resulting repository can be pushed to GitHub using a verified account email. GitHub recalculates contribution colors against the account's complete history, so the final shades may vary, but the underlying drawing and commit cadence remain intact.